Virginia had three constitutional amendments on this year's ballot: one protecting abortion rights, one removing the old same-sex marriage ban, and one restoring voting rights to people with felony convictions once they're released. I was pretty sure I knew how they'd go.
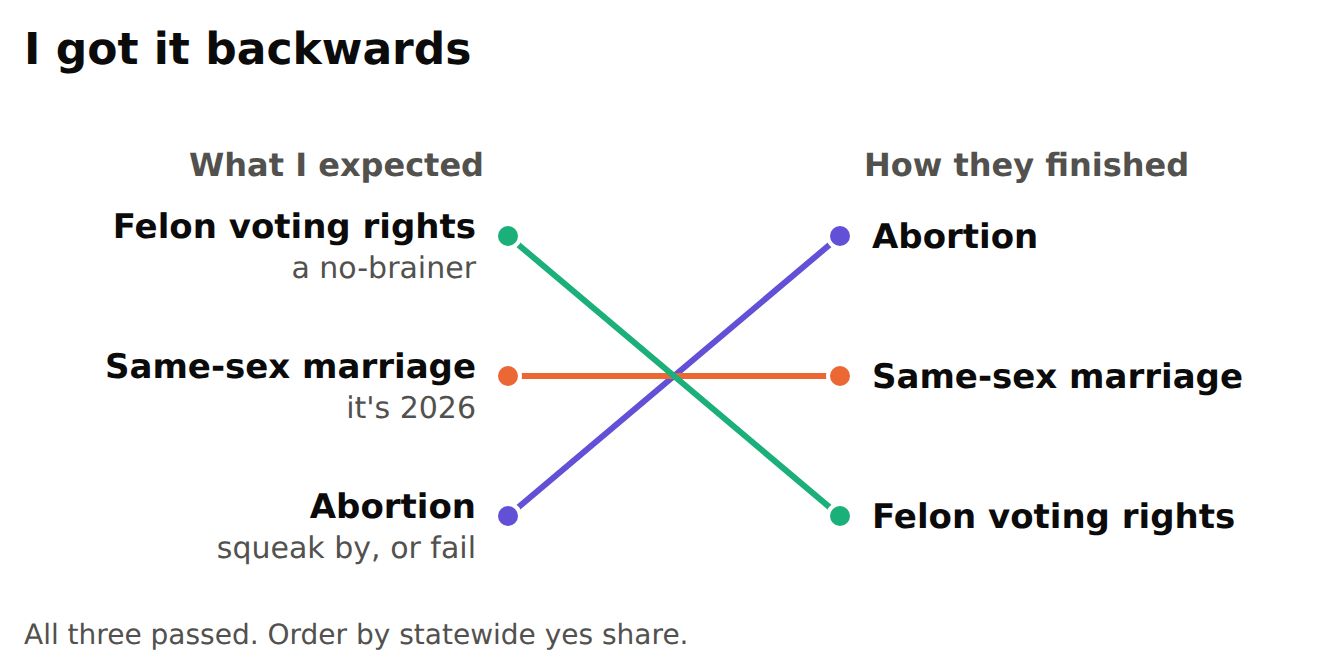
Here were my guesses. Felon voting rights would be a no-brainer: plenty of people know someone with a record, second chances appeal to both sides, and I assumed that, unlike abortion, it wasn't an issue that splits the country down the middle. Abortion, I figured, would squeak by or fail. There's a lot of red in Virginia. And marriage? It's 2026. Who's against that now?
All three passed. In exactly the opposite order.
Who crossed party lines
I wanted to know why, so I pulled the state's precinct-by-precinct results. Ballots are secret, so nobody knows how any one person voted. But Virginia has about 2,500 precincts, ranging from deep red to deep blue, and lining them up lets you estimate how each side voted. I used the Senate race as the marker: Mark Warner's voters stand in for Democrats, Bert Mizusawa's for Republicans.
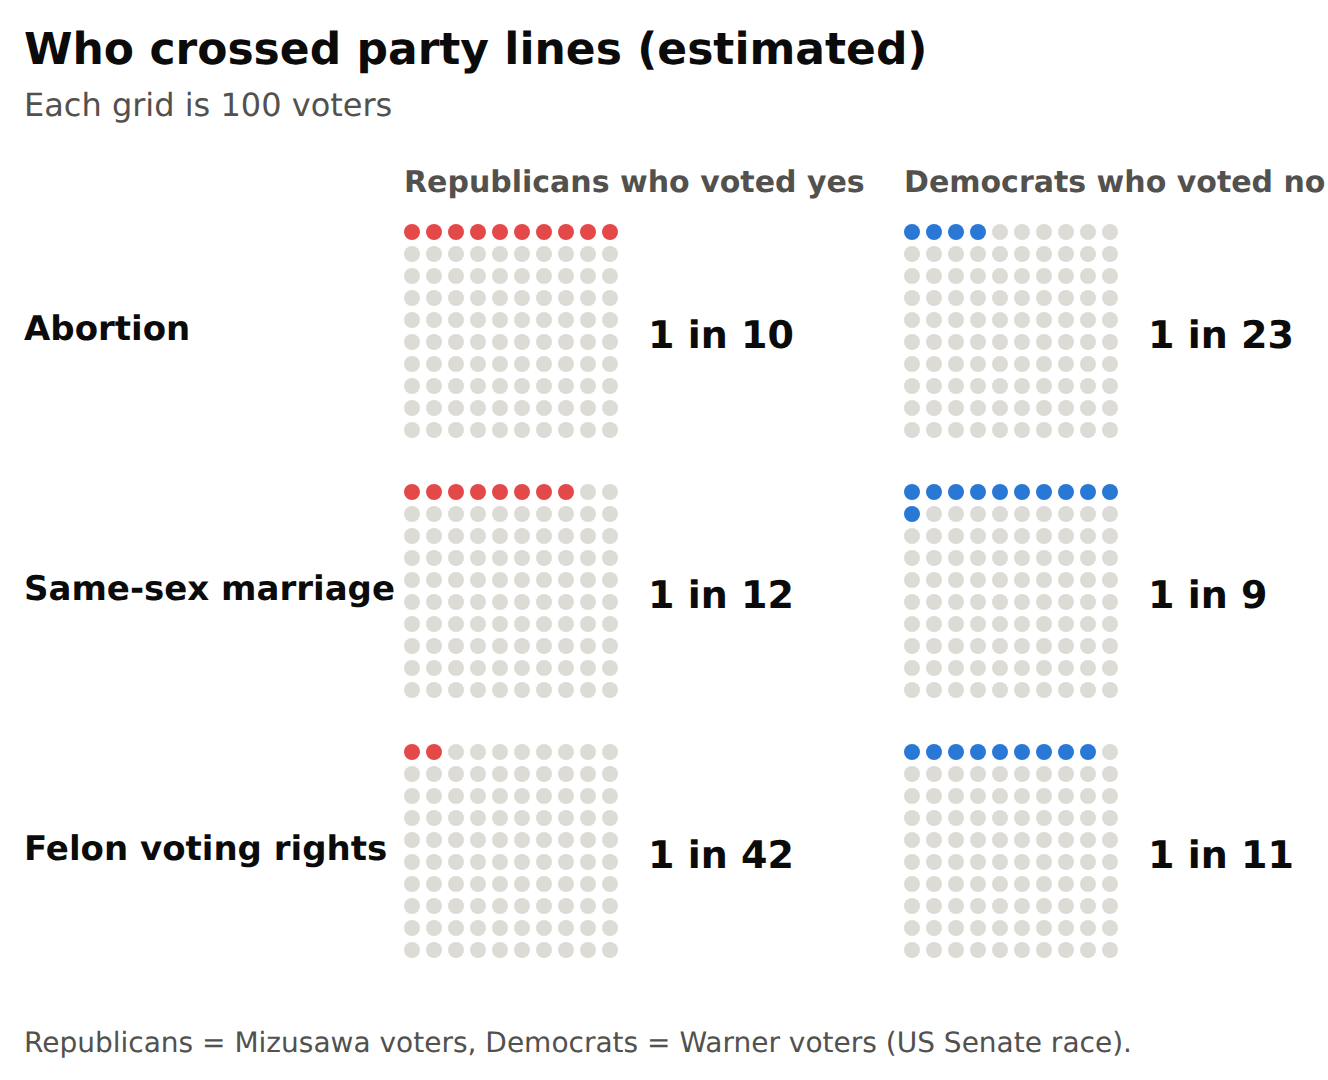
About 1 in 10 Republicans voted yes on abortion. On marriage it was about 1 in 12. On felon voting rights it was about 1 in 42, almost none. And voting rights lost about 1 in 11 Democrats, nearly as many as marriage did.
So the amendment I thought would sail through drew almost no Republicans and still lost Democrats. The one I thought too divisive drew the most Republicans across.
A closer look
Then I added Census data. On the Democratic side, the marriage "no" vote climbs with the Black share of adults in the precinct: about 1 in 18 in precincts under 10% Black, about 1 in 4 in majority-Black precincts. Abortion's "no" rises too, though less, from about 1 in 37 to 1 in 11. The voting rights "no" barely moves, around 1 in 10 everywhere.
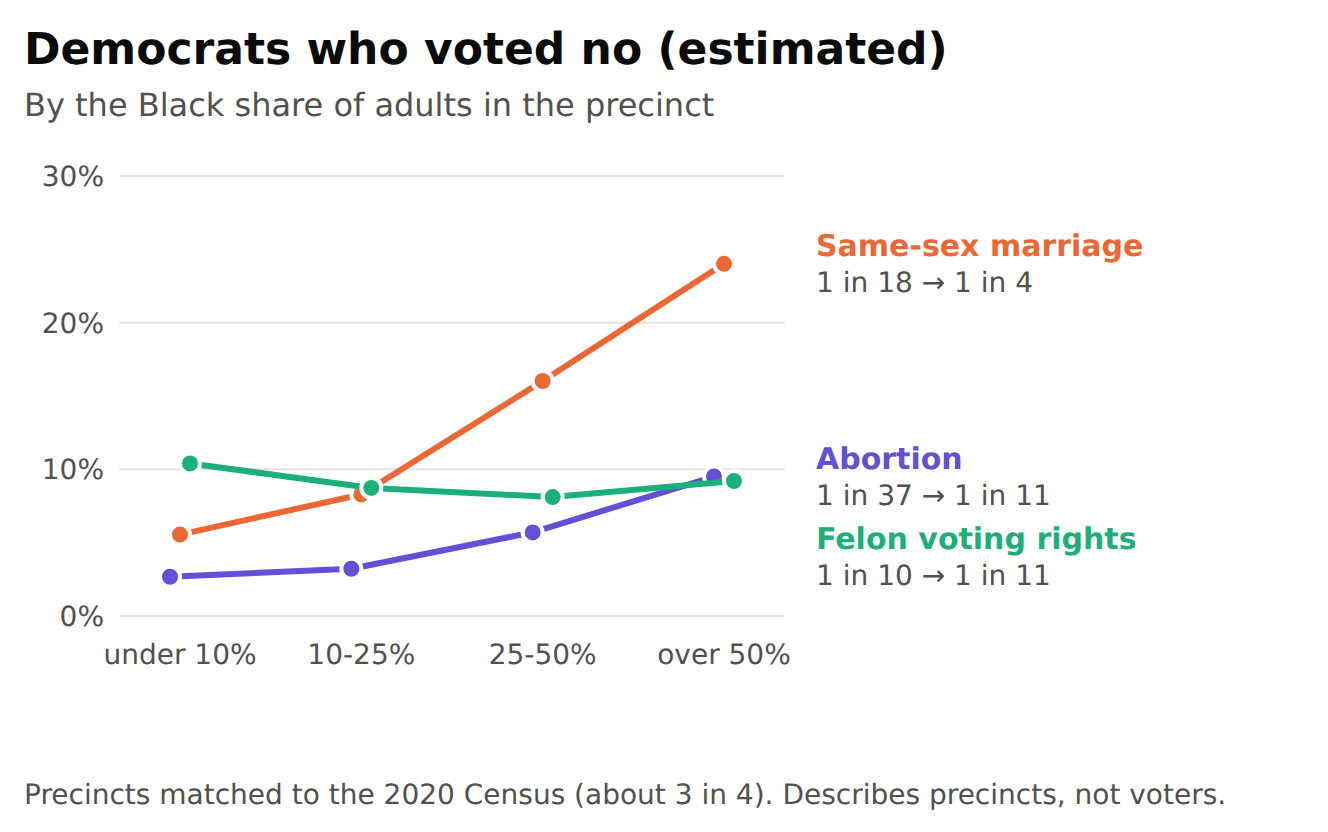
That's a fact about precincts, and only the three-quarters of them I could match to Census data. It can't tell me how any individual voted, or why.
On the Republican side, I split counties and cities by median household income. Where it's $80k or more, Republicans were about twice as likely to vote yes on abortion, and roughly three times as likely on marriage, as in the rest of the state. Voting rights stayed near zero in both.
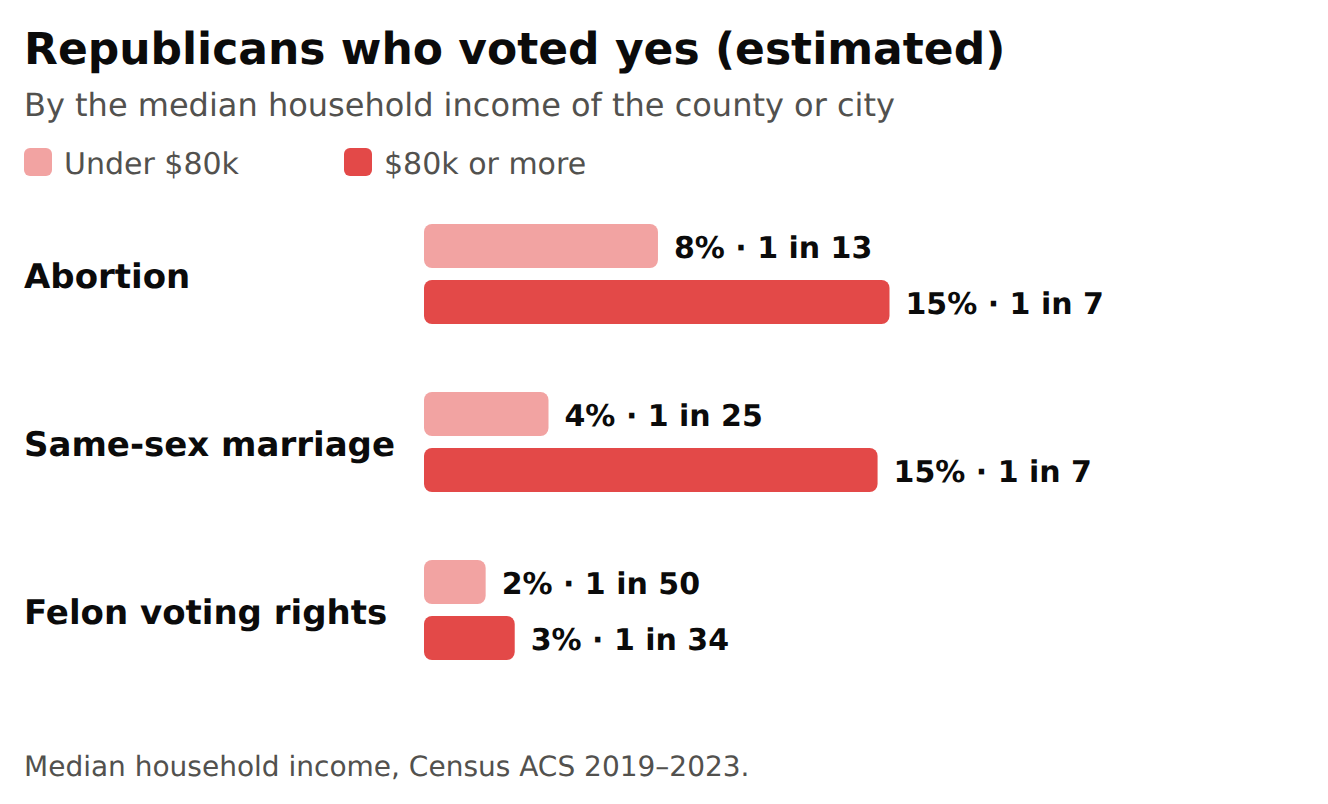
Higher-income places also tend to be more suburban and college-educated, so income may just be standing in for those.
What I learned
People mostly voted with their party, as I'd expect. What I got wrong was which issues would pull people across. The one I was sure would divide people drew the most Republicans across. The ones that felt like settled common sense to me, second chances and marriage, weren't settled across party lines.
I figured where I live explained some of my blind spot, and partly it does. Here in Arlington, abortion and marriage each got about 81% yes, and voting rights got 75% (Election Day votes only; Arlington's early votes weren't in yet). That's far more than the roughly 55% it got statewide, but it still came in last. About 1 in 4 of my neighbors voted against the idea I'd have called a no-brainer.
Kathryn Schulz has a great TED talk, On Being Wrong, where she asks what it feels like to be wrong. Her answer: being wrong "doesn't feel like anything." She compares it to Wile E. Coyote after he's run off the cliff, before he looks down: "we're already wrong, we're already in trouble, but we feel like we're on solid ground." Then she corrects herself: it "feels like being right." That was me. I've been walking around sure that second chances were something nearly everyone around me agreed on. Analyzing these numbers was me looking down.
About the numbers
These are estimates, not counts, so treat them as rough. The marriage numbers are the shakiest: how Democrats voted on it varied a lot from precinct to precinct, which throws off the statewide estimate, and the real Republican crossover on marriage is probably lower than 1 in 12. Even taken at face value, it could plausibly be anywhere from about 1 in 9 to 1 in 18.
They're also based on unofficial results as of the evening of November 4, when about 50 of Virginia's 133 counties and cities still hadn't loaded their early votes. Where they had, Republican crossover ran a little higher, but the pattern was the same.
I built this with Claude and had other AI models try to poke holes in it, but the real check is the scripts below: they pull the state's data and reproduce every number here.